 You can use the applet below to sketch the shape of the Maxwell-Boltzman energy distribution for the same molecule at a lower and at a higher temperature.
You can use the applet below to sketch the shape of the Maxwell-Boltzman energy distribution for the same molecule at a lower and at a higher temperature.
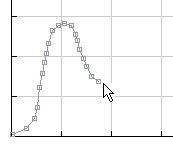
The curves are best drawn as a series of small lines as shown in the diagram on the left. A maxiumum of 50 discrete lines are allowed for each curve.
Step 1: select the lower temperature of 1000 K and sketch a distribution curve.
Step 2: select the higher temperature of 2000 K and sketch a second distribution curve.
Step 3: press Analyse for the program to make an analysis of your sketch.
If you have drawn the two distribution curves correctly, the maximum for the distribution curve at the lower temperature should be at a lower kinetic energy, but at a greater fraction of molecules, than the maximum for the higher temperature distribution.
The applet analysis should help you recognise this feature in your sketching.
Compare your work with the applet below.